Diversion Over Time
As an emerging best practice for homeless and housing services, Diversion and Rapid Resolution are becoming an important part of how communities reduce and end homelessness. Considering implementing a diversion program on a system-wide level, a natural question emerges as to what percentage of overall people experiencing homelessness might have successful diversions.
A general target for communities launching a Diversion or Rapid Resolution initiative is 20% for families and 30% for families in the first one to three years.
This article explores: What does Diversion data look like in after this initial phase? is it possible to continue to develop and divert at higher rates or should we expect to continue to divert around 20% of individuals and 30% of families seeking shelter services? What should we set out as a goal?
To explore this question, data from the Connecticut Coalition to End Homelessness (CCEH) has some of the most comprehensive data available on shelter diversion. Through their Data Dashboards statewide information is available, divided into seven Coordinated Access regions from 2016 until present.[i] A regional map of the Coordinated Access regions can be found here.
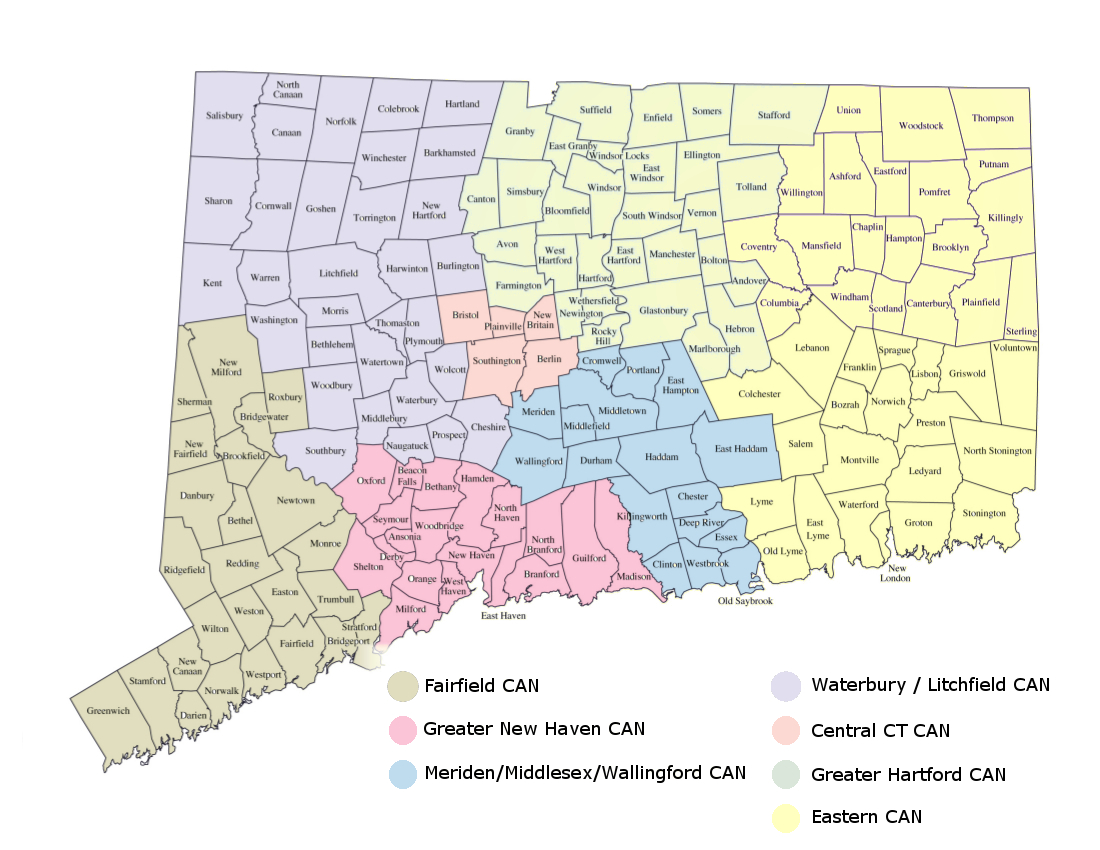
Connecticut launched Diversion as a statewide initiative with a training in 2016 and limited funding through a training with the Cleveland Mediation Center, however the Eastern region had a case study focusing on Family homelessness in 2013. While for many regions 2016 can be considered the first year of Diversion implementation, for the family providers of Eastern, CT they had had an established program in the past.
Why Connecticut? Connecticut’s data resources are chosen because it is the best quality and quantity of publicly available data on Diversion. This article is not intended to present Connecticut as an ideal approach, but instead answer what Diversion results may be possible over the span of five years. The dashboards available also offer information on seven different regions of the state, allowing for examination of the variation in trends between communities of different characteristics.
To read more about the limitations of the data and implications, a full analysis is available here (linking to disclaimer).
Findings

In 2016, the average Diversion rate across regions is 16.83% of the total population seeking shelter services. In 2020, the average Diversion rate reached 42.58%. The table above shows that the most significant improvements appeared to occur between 2017 and 2018. For many communities, there was a dip or slowing of growth between 2019 to 2020.
Every region saw their diversion rate improve over the course of 5 years. Meriden, Middlesex, Wallingford (MMW) saw the most significant improvement, beginning at a Diversion rate of 3.3% in 2016 and reaching 43.6% in 2020. The Greater Hartford area reached the highest overall percentage of Diversions in 2020 with 53.2%
Family Diversion Rates
Significant strides in the Diversion of Families appears to be a driving force behind the improvements described above. The average Family diversion rate in 2016 was 31.81%. By 2020, the average regional diversion rate was 76.3%.

Every region reached the initial target of a 30% diversion rate for families by 2018. The Meriden, Middlesex, Wallingford (MMW) region showed the most improvement, from 6.6% to 87.5%, as well as the highest overall diversion rate.
The results illustrate the significant promise of Diversion programs as a tool for ending and reducing family homelessness.
Why do we see such high diversion rates among families? There are a few theories; more funding typically exists for family diversions as well as state-level resources, family and friends are more likely to intervene with support when children are involved, providers may be more motivated to prevent children from experiencing homelessness, landlords may be more open to negotiation. Continued research may be necessary to discover the influence of these potential factors.
Individual Diversion Rates
While families are an important driver of the improvement among the overall population, Diversion rates among individuals has also improved significantly. The average Diversion rate in 2016 was 12.23% and has reached 41.93% in 2020.

The MMW region again demonstrated the most improvement, beginning with a individual regional rate of 2.5% in 2016 and reaching 42.78% for 2020. All regions in Connecticut had surpassed the individual diversion rate target of 20% by 2020. The highest overall individual diversion rate was 52.67% in the Greater Hartford region.
Implications:
Diversion Rates went up in every region. Diversion rates improved significantly in every region of Connecticut from 2016-2020. The target diversion rate of 20% for Individuals and 30% for Families was reached in every region of the state. While regions did not see increases every year, the average region saw an improvement of around 25 percentage points for their total population, with the smallest just at 10 percentage points.
Diversion has become the primary intervention for Families experiencing homelessness in every region of Connecticut. In 2020, every region diverted over half of families seeking shelter services, with MMW leading at 87.5%.
Homelessness and housing instability can have a significant affect the development, education, and overall wellbeing of children. Family Shelter Diversion illustrates a meaningful component of the effort to mitigate and end family homelessness.
Investing in Diversion for Individuals makes strides over time. Investing in Diversion programs focused on individuals is still very much worth it despite having lower rates compared to Families.
Given the impact of experiencing homelessness and housing instability on physical and mental wellbeing, these results provide a promising argument for the Diversion intervention as an improvement to housing crises response systems.
Training & Implementation have a Long-lasting Impact. Eastern, CT, which hosted a pilot for Family Diversion in 2013, showed the highest 2016 rates for families at 65% and continued to make strides to 83.21% by 2020. While Eastern led initially on Family Diversion rate, their individual rate was similar to peer communities. This suggest that the impact of the initial training and pilot program from 2013, years prior to statewide and individual implementation, left a lasting impression on the community.
If you are aware of additional sources of publicly available data, please let us know!
[i] The CCEH Dashboards include data prior to 2016, however this data was collected prior to general trainings on Diversion and data collection as well as the standardization of a statewide definition.